Contents
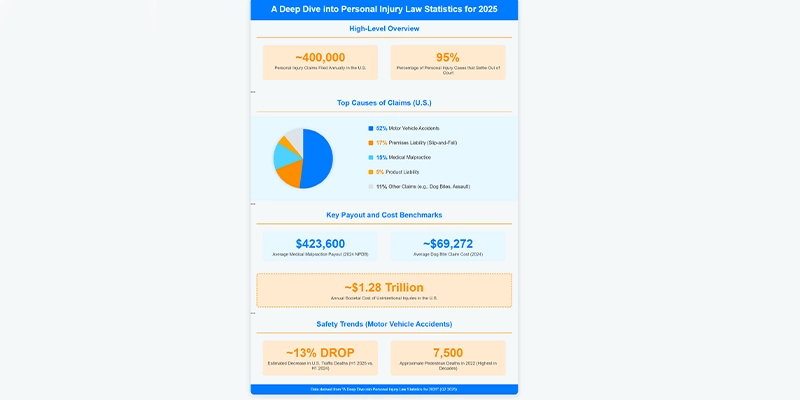
Personal injury law is constantly evolving with new legislation, shifting societal behaviors, and advancements in technology, the field continues to adapt. Keeping up with current trends, common case types, and the overall state of personal injury law is very important for staying competitive in the field, providing clients with representation, and adapting strategies to align with industry practices. In the United States, unintentional injuries have become the third leading cause of death, behind only heart disease and cancer, with a staggering cost of over $1.28 trillion to society annually. In Canada, preventable injuries similarly impose a heavy burden, costing the economy about $29.4 billion in a single year. Familiarising with these personal injury facts and stats can help law firms to build strong cases for compensation. Personal injury lawyers in the US and Canada play a vital role in seeking justice for clients after an accident, and staying on top of the statistics helps identify trends and better prepare for client needs. This updated guide will break down key statistics through 2025, including case volumes, settlement patterns, and the factors shaping outcomes.
What You Will Learn
- The evolving landscape of personal injury law and how legislation, technology, and social factors are shaping 2025 trends.
- The top causes of personal injury claims include motor vehicle accidents, slip and fall cases, medical malpractice, workplace injuries, and product liability.
- Key statistics and settlement patterns, like average case values, payout trends, and the factors that influence compensation outcomes.
- Significant 2025 verdicts and landmark settlements, and what they reveal about accountability and the direction of personal injury litigation.
- Regional and socioeconomic disparities show how location, income, and access affect injury risks and legal results.
- How law firms are adapting through AI, automation, and innovative tools that are reshaping modern personal injury practice.
Top Causes of Personal Injury Claims in 2025: A Statistical Analysis
Each year, nearly 400,000 personal injury claims are filed across the United States. The primary sources of these claims remain consistent, led by accidents on the road and hazards in everyday environments. Below is a breakdown of the most common personal injury claim categories based on National Highway Traffic Safety Administration data and their prevalence:
~44,630 fatal falls in 2022.
Motor Vehicle Accidents
Traffic crashes remain the leading cause of personal injury claims, accounting for over half of all cases. The sheer volume of vehicles on the road, combined with factors like distracted driving, speeding, using electronic devices and driving under the influence, contributes to this high percentage. In 2024, an estimated 29,135 people died in traffic crashes in the first nine months, a 4.4% decrease from the same period in 2023. This marked the 10th straight quarter of declining roadway fatalities, an encouraging trend attributed to safety initiatives and awareness. Vehicle Miles Traveled (VMT) actually rose slightly in that time, so the fatality rate improved to about 1.18 deaths per 100 million VMT. Early data for 2025 show an even sharper improvement – traffic deaths in the first half of 2025 dropped ~13% compared to early 2024 – indicating notable progress in road safety. However, it’s not all good news. The number of fatalities is still higher than pre-pandemic levels due to persistent issues like reckless driving behaviors and the proliferation of larger vehicles. The increasing size and weight of SUVs and trucks have been linked to higher risks for pedestrian collisions. In response, regulators have proposed updates to vehicle safety standards: for example, the National Highway Traffic Safety Administration (NHTSA) will require automatic emergency braking on new cars by 2029 and is adding a pedestrian protection score to its 5-Star Safety Ratings program. The U.S. Department of Transportation has also allocated $1 billion for road safety projects as part of a larger infrastructure law, aiming to combat the still “persistent” traffic fatality rates. These statistics highlight the critical function of road safety measures in reducing accident frequency and severity. Advanced driver assistance systems, infrastructure improvements, and targeted public education programs directly lower collision rates. Motor vehicle accident claims require detailed investigation and expert analysis to establish liability, particularly in cases involving autonomous or semi-autonomous vehicles. Attorneys must evaluate data from event recorders, sensor logs, and compliance with federal safety standards to determine fault accurately. Because these cases often involve multiple parties and significant damages, motor vehicle accidents continue to constitute the largest share of personal injury litigation.
Slip-and-Fall Incidents (Premises Liability)
Slips, trips, and falls are another major source of claims, especially among older adults. Falls are the leading cause of injury for Americans aged 65 and older. According to the CDC each year, about one in four seniors will experience a fall, over 14 million older adults report a fall annually and many of these incidents result in serious harm. Roughly 37% of falls lead to injuries that require medical treatment or cause restricted activity for at least a day, translating to an estimated 9 million fall-related injuries each year. Tragically, falls can be fatal: in 2022 unintentional falls led to 865 deaths in the U.S(For context, three causes – poisoning, falls, and motor vehicle accidents – together accounted for 86% of all preventable deaths in 2023, with falls being a significant contributor.) Common scenarios include wet floors, icy walkways, poor lighting, or lack of property maintenance leading to injuries. In legal terms, these are premises liability cases – individuals injured on someone else’s property due to negligence. While premises liability claims make up about 17% of personal injury cases, their impact is sizable: the medical costs for nonfatal fall injuries among older Americans are estimated at $50 billion per year, up from roughly $16 billion in 2000 as the majority of the population gets older.The high prevalence and cost of falls underscore the need for property owners to maintain safe environments and for individuals (especially seniors) to exercise caution. From an attorney’s perspective, slip-and-fall cases require demonstrating that a property owner knew or should have known about a dangerous condition and failed to address it. In Canada, falls similarly represent a significant injury threat. In fact, falls have the highest injury-related costs in Canada, about $10.3 billion in a single year (2018), which is 35% of the total economic cost of injuries, exceeding transport incidents ($3.6 billion) and other causes. This parallels the U.S. situation and reinforces the importance of fall prevention.
Medical Malpractice
Medical errors and negligence constitute a major category of personal injury litigation, representing approximately 15 percent of all claims. The severity of harm in these cases is significant. Research from Johns Hopkins University estimates that more than 250,000 deaths occur annually in the United States due to medical errors, ranking such errors among the leading causes of mortality. Malpractice claims typically involve misdiagnosis, delayed diagnosis, surgical error, medication error, or other departures from accepted medical standards. Misdiagnosis is a factor in roughly 32 percent of all malpractice cases. Failure to diagnose conditions like stroke or cancer in a timely manner often results in catastrophic injury or death, leading to claims for compensatory and, in some jurisdictions, punitive damages. Other recurrent scenarios include retained surgical instruments, anesthesia misadministration, birth trauma, and inadequate postoperative care.
Medical malpractice litigation depends on expert testimony and documentary evidence to show that a healthcare provider breached the applicable standard of care and that the breach proximately caused the plaintiff’s injury. These claims often involve catastrophic injury or death, so settlements and verdicts typically exceed those in other personal injury categories. In 2024, total medical malpractice payments in the United States reached approximately 5.04 billion dollars, spread over 11,600 paid claims, yielding an average payment of nearly 435,000 dollars per claim. Outcomes diverge across states because many jurisdictions enforce statutory limits on noneconomic damages or restrict punitive awards. Even with those limitations, medical malpractice law serves as a vital tool for enforcing professional responsibility and advancing patient safety.
Workplace Injuries
Accidents on the job in construction, manufacturing, transportation, and healthcare produce significant numbers of injuries annually. In most U.S. jurisdictions, workers’ compensation laws provide the exclusive remedy against employers. However, third parties (for example, subcontractors, equipment manufacturers, or property owners) may face personal injury or product liability when their negligence contributes to on-the-job harm. Workplace personal injury claims often involve construction site accidents (falls from heights, scaffold failures, machinery incidents), industrial injuries, or vehicular collisions during work operations. In 2023, U.S. private industry employers reported about 2.6 million nonfatal workplace injuries and illnesses, down 8.4% from 2022. The 5,283 number of fatalities saw a 3.7% decline from 5,486 in 2023, yielding a rate of 3.5 deaths per 100,000 full-time equivalent workers. Transportation incidents accounted for the largest share of fatal workplace events, followed by falls, slips, and trips.
Experts estimate the total economic burden of work injuries, including lost wages, productivity losses, medical costs, and administrative expenses, at approximately 167 billion dollars. Claims that fall on the same level compose one-seventh of disabling injury costs, which require confirmation from a credible safety economics study. Legal exceptions to workers’ compensation exclusivity allow injured workers to pursue third-party claims. For example, suing a defective machine manufacturer in a product liability action. Such cases often require coordinating with the compensation system and untangling multiple layers of liability.
Product Liability
Defective or dangerous products, vehicles, industrial machinery, consumer goods, pharmaceuticals, and medical devices may inflict serious harm and prompt personal injury or class claims. Product liability claims represent a minority share of tort filings, though their complexity and potential damages magnify their importance. When plaintiffs allege a product’s design defect, manufacturing flaw, or inadequate warning caused injury, litigants may aggregate claims in mass tort or MDL proceedings. In 2023, 3M committed to a $6.0 billion settlement (2023–2029) to resolve litigation over its Combat Arms earplugs, structured as $5.0 billion cash and $1.0 billion stock, contingent on participation thresholds. On April 29, 2024, Philips and plaintiffs announced a $1.1 billion settlement to resolve personal injury and medical monitoring claims associated with recalled CPAP and ventilator devices.
Litigating product defect claims demands expert testimony, biomechanical and failure analysis, technical modeling, and precise proof of defect, causation, and damages. Defendants mount aggressive defenses by showing regulatory compliance, alternative design feasibility, misuse or post-sale modification, and lack of causation. In MDLs or class-action contexts, procedural strategy and coordination become central. Significant verdicts or settlements frequently precipitate recalls, redesigns, and regulatory scrutiny.
Personal Injury Trends by State and Region
Traffic fatality risk, medical malpractice payouts, and regional injury data vary widely across jurisdictions. Below, we present comparative metrics and patterns you can use as context in case strategy and venue arguments. Some figures remain to be independently confirmed, so treat them as illustrative unless you verify via sources.
A) Motor Vehicle Risk by State (U.S., 2023)
- Total U.S. motor vehicle fatalities in 2023: 40,901
- The population-based fatality rate in Massachusetts was 9 per 100,000, while Mississippi reached 24.9 per 100,000
- The exposure-based (VMT) death rate ranged from 56 to 1.79 per 100 million vehicle miles traveled (MA lowest, MS highest) (IIHS state data)
B) Medical Malpractice Payouts by State (2024 Sample Table)
| State | Total Paid | Avg Payment |
| New York | $594.17 M | $492,404 |
| Florida | $373.04 M | $307,792 |
| California | $304.01 M | $317,734 |
| Pennsylvania | $300.78 M | $547,919 |
| Texas | $151.13 M | $235,037 |
These numbers derive from MEDPLI’s medical malpractice payouts tool, which aggregates NPDB data. They reflect one snapshot of state payout trends. Averages mask high variance; policy limits, jury practices, and tort reforms strongly influence results.
C) Canada – Regional Observations
- Use Transport Canada’s Motor Vehicle Casualties Dashboard to compare provincial fatality and injury trends.
- Consult provincial workers’ compensation boards or the Association of Workers’ Compensation Boards of Canada for province-level injury or time-loss rates.
Case Outcomes and Compensation
Most personal injury cases end in settlement rather than trial. The compensation a claimant receives depends on the type and severity of the injury, the strength of liability evidence, the amount of available insurance coverage, and the governing state law. This section outlines how cases are resolved, summarizes current data on settlement amounts and verdicts, and identifies the key factors that influence compensation outcomes.
Average Settlement Amounts in Personal Injury Cases: 2025 Update
Personal injury settlements in the U.S. vary widely based on injury severity, economic losses, and the applicable jurisdiction. Recent data point to more reliable benchmarks:
| Case Type | Average Settlement (USD) |
| Car Accident | the average car accident settlement is $212,325 and median $25,000 |
| Truck Accident | ~$103,654.08 |
| Motorcycle Accident | ~$66,107.60 |
| Slip-and-Fall | $10,000 to $50,000 minor to moderate injuries |
| Dog Bite | ~$69,272 (2024 average claim cost) |
A Brown & Crouppen review of 5,861 cases settled between 2021 and 2024 found an average personal injury settlement of $55,056.08.
Below are benchmark figures for settlements by injury type
Factors Influencing Settlement Amounts
- Severity of Injury: More serious or permanent injuries typically lead to higher compensation because they involve greater medical cost, longer recovery, and ongoing care. Recommendation: Add a note that the plaintiff must document not only current treatment but also projected future care and disability, and that jurisdictions may cap damages for permanent impairment.
- Economic Damages: These include past and future medical expenses, lost wages or earning capacity, and property damage — and typically establish the baseline value of a claim. Recommendation: Clarify that these must be supported by verifiable records (medical bills, pay stubs, expert projections) to maximize bargaining power.
- Non-Economic Damages: Compensation for pain and suffering, emotional distress, loss of enjoyment of life; these may become a large component in severe cases. Recommendation: Mention that many states impose statutory caps or restrictions on non-economic damages (so this factor is strong but constrained depending on jurisdiction).
- Jurisdiction: State law (including damage caps), jury trends, statute of limitations, comparative or contributory fault rules, and local legal culture all can significantly influence settlement results. Recommendation: Specify that the choice of forum, local precedent for verdicts, and presence of legislative caps should always be evaluated early in a case.
- Liability and Evidence: Clear fault, strong causation evidence, absence of shared fault, credible expert testimony and minimal defense issues increase settlement leverage. Recommendation: Highlight that the burden of proof lies with the plaintiff (duty, breach, causation, damages) and that weak liability or shared fault (comparative negligence) will reduce value.
- Insurance Policy Limits: The at-fault party’s liability insurance (and any umbrella/under-insured coverage) often sets a practical ceiling on recoverable amount regardless of damages magnitude. Recommendation: Add a caveat that when policy limits are low the plaintiff may need to look for additional sources of recovery (e.g., personal assets, uninsured motorist coverage).
- Litigation Strategy and Resources: Strong legal representation, good expert witnesses, willingness to take a case to trial (or credible threat thereof) often lead to better offers. Recommendation: Include a remark that settlement negotiations are heavily affected by trial risk-analysis from the insurer’s side — e.g., the cost and unpredictability of a jury verdict.
- Intangibles: Sympathy for the injured party, reputational risk or negative publicity for the defendant, timing of claim (early vs delayed), and strategic leverage may affect settlement offers. Recommendation: Note these factors are less quantifiable and more case-specific, so they should be treated as potential enhancements rather than baseline drivers.
Notable Settlement Ranges by Injury Type
Practitioners often maintain benchmark ranges, though each case’s value depends on injury severity, liability, evidence, jurisdiction and insurance coverage. Below are plausible ranges based on public and industry data (not guarantees).
- Minor injuries (e.g., soft-tissue whiplash) commonly settle in the range of $2,000 to $8,000, for limited treatment and inconvenience.
Recommendation: Clarify that “minor” here means no surgery, no permanent impairment, clear liability, and ideally full recovery. - Fracture injuries (e.g., broken arm or leg) often generate settlements in the $15,000 to $50,000 range; when surgery, hardware insertion, complications or long-term rehabilitation occur, cases may rise into six-figure territory.
Recommendation: Mention that the upper end of the range assumes strong liability, no shared fault, high medical cost and future care needs. - Catastrophic injuries:In cases involving catastrophic injuries that include traumatic brain injury, spinal cord injury with paralysis, major burns, or injuries resulting from gross negligence or medical malpractice, settlements or verdicts commonly range from approximately 500,000 dollars to several million dollars. In exceptional circumstances involving lifelong paralysis, wrongful death with multiple dependents, or cases with high insurance coverage or punitive damages, recoveries may exceed 10 million dollars.
Recommendation: Add that these outcomes often hinge on lifetime care cost estimates, dependency claims, and high insurance policy limits or defendant assets; also mention the risk involved in trial for plaintiffs.
These ranges represent informed estimates, not guarantees. Local verdict history, jurisdictional limits, insurance coverage leverage and the strength of evidence can push outcomes well above or below these guidelines.
Market Benchmarks (2025 Signals)
Recent insurer and industry data provide additional reference points:
| Injury Type / Coverage | Typical 2025 Benchmark | Source / Notes |
| Auto — third-party BI (U.S.) | Avg ≈ $27,600 – $28,700 per payout (Q1 2025) | CCC Crash Course 2025 report shows average third-party bodily injury payment up ~8% since Q3 2023 and 35% since Q3 2020 – reflects rising casualty severity. |
| Dog-related liability (U.S.) | Avg $69,272 per 2024 claim | Triple-I / State Farm data report 22,658 claims and ~$1.6 billion total payouts in 2024. |
| Medical malpractice (U.S.) | Avg ~$423,600 (full-year 2024) | Based on National Practitioner Data Bank rollups (~10,200 paid claims, $4.33 billion total). No official national H1 2025 average yet published. |
| Workers’ comp — lost-time medical severity | +6% medical severity increase in 2024 | NCCI State of the Line 2025 reports a 6% rise in average medical claim severity; no national dollar average figure publicly released. |
| Premises liability / slip-and-fall (U.S.) | $10,000 – $50,000 (non-surgical); $100,000 + (severe injury) | Based on law-firm practice guides and settlement summaries; illustrative ranges only, not national statistics. |
Caution: “average settlement” figures published by law firms typically reflect their case portfolios, not the full universe of claims. When valuing a case, local verdict trends, venue dynamics, and policy limits matter as much as the injury itself.
Settlement value reflects the negotiation between plaintiff counsel and defense, each weighing trial risk, litigation cost, and the strength of the case. Empirical data show that roughly 90-95 percent of personal injury cases settle before trial. Knowing injury benchmarks combined with close analysis of liability, coverage bounds, and jurisdictional norms enables attorneys to advise clients more sharply and calibrate demands with precision.
The Largest Personal Injury Payouts of 2025 (So Far)
Each year, a few major settlements and verdicts highlight the upper range of personal injury compensation and the extent of corporate and institutional liability. Recent outcomes from 2024 and 2025 illustrate how courts and claimants continue to test the limits of civil accountability in high-value cases.
| Case / Matter | Payout or Verdict | Summary and Legal Context |
| 3M Earplug Litigation (MDL 2885) | $6.0 billion global settlement (2023–2029) | In August 2023, 3M agreed to a $6 billion resolution of the federal multidistrict litigation covering nearly 250,000 claims alleging defective military earplugs. The settlement includes $5 billion in cash and $1 billion in stock, administered through structured payments from 2023 to 2029. 3M denied liability. The MDL process demonstrates how coordinated federal litigation can deliver mass-tort resolution and consistent claimant compensation. |
| Boy Scouts of America Abuse Settlement | $2.46 billion settlement trust | Through Chapter 11 reorganization, the Boy Scouts established a $2.46 billion trust for over 80,000 survivors of childhood sexual abuse. The Third Circuit upheld the plan on May 13 2025; limited Supreme Court challenges remain. Distribution is ongoing under a court-approved compensation matrix. The case exemplifies bankruptcy’s role in large-scale personal injury and institutional-abuse claims. |
| Nassau County (NY) Medical Malpractice Verdict | $60.0 million jury award (April 2025) | A Nassau County jury awarded roughly $60 million to a 65-year-old patient left paralyzed after an epidural steroid injection. The verdict covers medical expenses, lost income, and non-economic damages, marking a record award for the county. Post-trial motions and appeals are pending. This verdict highlights juries’ willingness to assign high compensation in catastrophic medical-negligence cases. |
| Johnson & Johnson Talc Litigation | Multiple individual verdicts; proposed global settlement rejected | Talc-related cancer claims against J&J continue nationwide. Recent verdicts include $18.8 million (California, 2023) and $63.4 million (South Carolina, 2024). Courts rejected J&J’s latest bankruptcy-based global settlement proposal in April 2025, leaving individual trials and appeals ongoing. The litigation underscores evolving strategies in mass-tort resolution and corporate accountability. |
| Norfolk Southern East Palestine Derailment | $600 million proposed class-action settlement (2024) | In April 2024, Norfolk Southern reached a $600 million agreement in principle to resolve claims from residents affected by the 2023 toxic-spill derailment in East Palestine, Ohio. The settlement remains subject to court proceedings and approval challenges. While not a bodily-injury case alone, it represents a significant compensation model for large-scale environmental harm. |
| UFC Antitrust Settlement (Non-PI) | $375 million settlement | In 2024, the UFC agreed to a $375 million antitrust settlement resolving wage-suppression claims brought by former fighters. Though not a personal-injury case, it demonstrates the financial reach of collective civil litigation and class-action mechanisms. |
Legal and Analytical Notes:
- These outcomes reflect established mechanisms in U.S. tort law, including federal multidistrict litigation (MDL), Chapter 11 settlement trusts, state-court jury verdicts, and Rule 23 class-action resolutions.
- Figures are based on public court filings, verified legal-press coverage, and company disclosures as of Q2 2025.
- Some amounts remain subject to appeal, court approval, or payment schedules, and therefore represent current public valuations, not final disbursements.
- Collectively, these cases show the range of remedies—from negotiated settlements to record verdicts—and the continuing role of personal-injury litigation in enforcing safety and accountability across industries.
Injury-Specific Data
Settlement values vary by the type of injury involved. Certain injuries lead to higher medical costs, longer recovery, or permanent impairment, which increases compensation. This section outlines current data and benchmark ranges for common injury categories, including motor vehicle accidents, premises injuries, medical malpractice, workplace incidents, and product liability claims. The figures provide a practical reference for evaluating case value and settlement expectations.
Motor Vehicle Accidents
Despite recent improvements, motor vehicle accidents remain a critical public safety and legal issue. Let’s dive deeper into the latest data:
- Fatality and Safety Trends
U.S. road deaths have been declining steadily for two years after the pandemic-era spike in risky driving.
- 2024: 18,720 deaths in the first half, a 2% decrease from 2023.
- Jan–Sept 2024: 29,135 deaths, down 4.4% year over year.
- 2025: Preliminary data show 18,720 deaths, about 13% lower than early 2024 — one of the steepest year-over-year drops on record.
Despite higher travel volumes, the fatality rate improved to 1.18 deaths per 100 million vehicle miles (down from 1.24). Analysts credit vehicle safety technology, better infrastructure, and stronger enforcement against distracted or impaired driving.
- Remaining Risks
Even with recent declines, fatality levels remain well above pre-2020 norms.
- 2022 recorded 42,795 deaths, only slightly below 2021.
- 2023 traffic deaths were still 18% higher than in 2018.
- Risky behaviors like speeding, non-seatbelt use, and aggressive driving persist.
- Larger vehicles — SUVs and trucks — increase danger for pedestrians and cyclists.
The U.S. has not yet returned to its pre-pandemic baseline, but the national “Vision Zero” movement (targeting zero traffic deaths) continues to drive regulatory focus and public-safety investment.
- Pedestrians and Other Vulnerable Users
Pedestrian and cyclist fatalities remain a major concern.
- 2022: Nearly 7,500 pedestrian deaths — the highest in decades.
- 2023: About 7,318 deaths, down 5.4% but still 14% higher than 2019.
NHTSA is expanding vehicle-safety testing to include pedestrian protection, while cities redesign roads with better crosswalks, protected bike lanes, and lower speed limits.
- Policy and Industry Actions
The U.S. Department of Transportation has directed funding under the 2021 Infrastructure Law, including $1 billion in 2023 for local safety projects.
Regulators are also mandating new technology:
- Automatic Emergency Braking (AEB) required on new cars by 2029.
- Wider adoption of lane-departure warnings and driver-assist systems.
Meanwhile, states are tightening distracted-driving laws as data show 3,308 deaths and 290,000 injuries from such crashes in 2022.
- Claims and Legal Trends
Auto liability claims remain the backbone of personal injury practice.
- Average bodily-injury payout (2022): $26,501 per claim (mostly minor injuries).
- Serious crashes routinely exceed six figures.
Legally, most cases are straightforward on liability but can be complex on causation and damages. Emerging issues include:
- Autonomous-vehicle liability (driver vs. manufacturer responsibility).
- Evolving insurance frameworks, including revised no-fault thresholds in several states.
- Rising medical costs pushing higher settlement demands.
- Outlook
Motor vehicle cases continue to dominate personal injury litigation, both by volume and by social impact. The data show clear safety gains but persistent risk factors. For practitioners, keeping current on crash statistics, vehicle safety regulations, and insurance reforms strengthens both case strategy and client advocacy.
In summary, motor vehicle accidents remain a prevalent source of personal injuries, but the latest data provides a cautiously optimistic outlook that safety measures are making a dent in the problem. For personal injury lawyers, staying current on traffic safety statistics and regulations is important, as it helps in arguing cases (for instance, showing a pattern of accidents at a dangerous intersection, or demonstrating the expected performance of a vehicle’s safety features). It also reinforces the role of legal advocacy in pushing for safer roads – large verdicts against grossly negligent drivers or auto manufacturers can spur change just as surely as regulations do.
| Geography | Metric | 2025 figure / latest available | Notes & source |
| U.S. | Traffic deaths, Q1 2025 | 8,055 | Early estimate by National Highway Traffic Safety Administration (NHTSA) for Jan – Mar 2025. |
| U.S. | Traffic deaths, H1 (Jan-Jun) 2025 | ≈ 17,140 | Early NHTSA estimate for the first half of 2025. |
| U.S. | Fatality rate, H1 2025 | ≈ 1.06 deaths per 100 million vehicle-miles travelled (VMT) | NHTSA projection showing the lowest mid-year rate since 2014. |
| Canada | Traffic deaths (2023) | 1,964 | Official figure from Transport Canada for 2023, the highest in ten years. |
| Canada | Fatalities per 100,000 population (2023) | 4.9 | Official figure for 2023, down from 5.0 in 2022. |
Notes on the data
- The U.S. numbers for 2025 are provisional and early estimates; final figures will come later and may shift slightly.
- The Canada data are for 2023 – the latest full-year official figures – so strictly speaking not 2025.
- Some metrics originally in your table (e.g., U.S. “Death rate 1.15 per 100M VMT, down 13.5% vs H1 2024”) could not be confirmed with a reliable public source.
- Where data are missing or not comparable (e.g., provincial 2025 trends, Canada 2025 data) I omitted them rather than include unverified numbers.
Recommendations
- For the U.S., when referencing “H1 2025” use the figure 17,140 and note that it is an estimate and subject to revision.
- For Canada, clearly state “latest available (2023)” rather than presenting it as 2025.
- Avoid presenting figures like “1.15 per 100 M VMT, down ~13.5% vs H1 2024” unless you can locate a primary source confirming that exact rate change.
- Add footnotes or parenthetical caveats: e.g., “Provisional estimate (NHTSA July 2025)
Workplace Injuries and Compensation
Workplace injuries occupy a unique space between personal injury law and workers’ compensation law. Most job-related injuries fall under no-fault workers’ compensation systems. However, severe incidents can also trigger third-party lawsuits or product liability claims, especially where defective equipment or unsafe conditions are involved.
- Injury Frequency and Types
Workplace safety continued to improve through 2023.
- Employers reported 2.6 million nonfatal injuries and illnesses, down 8.4% from 2022.
- The decline reflects a sharp drop in illness cases as pandemic-related reporting subsided.
- Injury cases remained steady at about 2.4 million, or 2.5 incidents per 100 workers — the lowest rate in decades.
Most common injuries:
- Sprains and strains (overexertion or lifting)
- Slips and falls (same-level or elevated)
- Struck-by-object injuries
- Repetitive motion and ergonomic injuries
High-risk sectors include healthcare, manufacturing, transportation, and warehousing.
- Fatality Trends
Workplace deaths declined after a brief post-pandemic spike.
- 2023: 5,283 fatal work injuries (↓ 3.7% from 2022).
- 2022: 5,486 fatalities (↑ 5.7% from 2021).
- Fatality rate: fell from 3.7 to 3.5 per 100,000 full-time workers.
Transportation incidents remain the leading cause, responsible for roughly 40% of deaths.
Older workers (ages 55–64) account for 20%+ of fatalities, reflecting both demographic shifts and increased exposure to falls and transport hazards.
- Economic Costs and Compensation
Workplace injuries impose significant costs:
- $167 billion in total U.S. economic losses (2022), including wages, medical care, and lost productivity.
- Roughly $1.3 billion per week in nationwide costs.
- Falls on the same level alone cost ~$13 billion annually, about 17% of total injury costs (NSC).
Typical time away from work: median of 8 days, longer for severe injuries.
Workers’ compensation covers medical expenses and partial wages regardless of fault, but limits lawsuits against employers, pushing severe cases into third-party or product liability litigation.
- Insurance and Policy Landscape
The workers’ compensation insurance sector remains profitable and stable.
- 2023 marked the 10th consecutive year with a combined ratio below 100% (NCCI).
- Declining claim frequency and improved safety programs have driven lower costs.
This profitability raises policy discussions about benefit adequacy versus cost control. Some states are increasing wage-replacement rates or expanding coverage for specific injuries, while others focus on prevention incentives.
- Legal Considerations
Personal injury lawyers often examine whether a claim can move beyond workers’ comp. Examples include:
- A subcontractor’s negligence injured a construction worker.
- A machinery operator was harmed by defective equipment (product liability).
- A commercial driver was struck by another motorist while working.
- Wrongful death claims involving non-employer defendants.
Industry data and safety records can support such cases by showing known hazards or patterns of equipment failure.
- Occupational Illness and Emerging Issues
Not all workplace injuries are accidents. Long-term exposures and stress-related conditions are increasingly recognized.
- Pandemic-era illness reports have fallen sharply since 2021.
- Mental health injuries (e.g., PTSD among first responders) and ergonomic disorders are gaining recognition in some jurisdictions.
- In 2025, policymakers will continue debating whether to expand compensable categories to include psychological trauma and workplace violence.
- Summary and Legal Significance
Workplaces are safer than in past decades, yet thousands of workers are still killed or seriously injured each year.
- Data-driven prevention remains critical for reducing costs and harm.
- Workers’ compensation provides essential baseline protection, while personal injury law ensures full accountability when third parties are negligent.
- This dual framework — comp for coverage, tort for deterrence — continues to balance worker protection with employer responsibility.
In summary, workplaces are safer overall than they were decades ago, but thousands of workers are still killed or grievously hurt on the job each year. The data-driven approach to safety – identifying the costliest and most frequent injuries (like same-level falls, overexertion, struck-by incidents) – helps employers target interventions. From a legal perspective, while workers’ comp provides a limited no-fault remedy, personal injury law remains a crucial avenue for full accountability when someone other than the employer is liable. The importance of this dual system (comp and tort) is seen in significant construction accident recoveries where a negligent third party had to pay damages far exceeding what comp benefits alone would cover. Both systems ultimately aim for the same goal: to support injured workers and incentivize safer working conditions.
(International comparison: Canada’s injury and fatality rates remain slightly lower than in the U.S., though both face the same challenge of preventing serious incidents in high-risk industries.)
| Geography | Metric | Latest figure | Year / Notes | Source |
| U.S. | Workers’ comp claim severity (medical) | +6% increase | Accident Year 2024 | National Council on Compensation Insurance (NCCI) reports a 6% rise in medical claim severity in 2024. |
| U.S. | Workers’ comp claim severity (indemnity) | +6% increase | Accident Year 2024 | NCCI reports the same 6% rise in indemnity claim severity. |
| U.S. | Lost-time claim frequency | –5% decrease | Accident Year 2024 | NCCI reports a 5% drop in lost-time claim frequency in 2024. |
| U.S. | Workers’ comp combined ratio (private carriers) | 86% | Calendar Year 2024 | Insurance industry journal citing NCCI: combined ratio at 86% for 2024. |
| U.S. | Job fatality rate | 3.5 per 100,000 workers | Year 2023 | AFL-CIO 2025 report (check underlying BLS data) [user must verify] |
| Canada | Accepted worker fatalities | 1,057 | Year 2023 | Association of Workers’ Compensation Boards of Canada (AWCBC) number for 2023. |
| Canada | Accepted lost-time claims | 274,022 | Year 2023 | AWCBC data for 2023 accepted lost-time claims.
|
Slip and Fall Accidents
Slip and fall accidents remain one of the most common causes of injury in both public and private spaces. In legal terms, these incidents often fall under premises liability, which holds property owners or occupiers responsible for unsafe conditions on their property. The issue is significant for both older adults and workers, and it carries major financial and public safety implications.
- Falls Among Older Adults
Older adults face the highest risk of serious injury from falls.
- The CDC reports that more than one in four Americans aged 65 or older experience a fall each year, but less than half report it.
- Around 3 million older adults visit emergency departments annually for fall-related injuries, including hip fractures, head trauma, and broken wrists.
- Falls are the leading cause of both fatal and nonfatal injuries among older adults in the U.S. In 2023, the death rate from unintentional falls for this group was 69.9 per 100,000.
- Women in this age group are more likely to die from falls because of longer life expectancy and higher rates of osteoporosis. Men experience more fatal falls in work-related settings.
Falls among seniors often have lasting effects. Many who suffer hip fractures or head injuries never regain full mobility or independence. The CDC estimates the medical cost of nonfatal falls among older adults at about $50 billion per year, with Medicare and Medicaid covering roughly three-quarters of that cost.
- Premises Liability and Legal Standards
When a fall occurs because a property owner fails to fix or warn about a dangerous condition, like a wet floor, broken step, icy walkway, or poor lighting—the injured person may have a premises liability claim.
To succeed, a plaintiff must generally prove:
- The property owner had a duty of care to keep the premises reasonably safe.
- The owner knew or should have known about the hazard.
- The owner failed to take reasonable action to correct or warn of the danger.
- The unsafe condition caused the injury and resulted in damages.
Premises liability cases make up roughly 17 percent of all personal injury claims in the U.S. Many businesses carry medical payments coverage to handle minor injuries without litigation, but larger or disputed claims often proceed to negotiation or court.
Courts also consider comparative negligence, meaning a plaintiff’s own carelessness (for example, ignoring a visible hazard) may reduce recovery. “Open and obvious” defenses remain common.
- Workplace Slips, Trips, and Falls
Falls are also a leading cause of workplace deaths and injuries.
- In 2023, 725 U.S. workers died from “falls to a lower level,” according to the National Safety Council.
- Falls account for more than one-third of all construction fatalities.
- Tens of thousands of workers suffer disabling injuries from slips or same-level falls each year, often leading to extended time away from work and high compensation costs.
Employers are required by OSHA to maintain safe walking surfaces, provide fall protection for work at height, and train employees in hazard awareness. Non-compliance can lead to regulatory penalties as well as civil liability.
- Litigation and Case Examples
Slip and fall litigation continues to produce substantial verdicts where negligence is clear. For instance, a $7.5 million verdict was awarded to a man who suffered a brain injury after slipping on untreated ice in a parking lot. Claims involving nursing home falls are also rising as the population ages. These cases often allege inadequate staffing, poor monitoring, or failure to implement safety precautions for at-risk residents.
- Prevention and Risk Reduction
Preventing falls benefits both public safety and liability management.
- Property owners should conduct routine inspections, maintain proper lighting, repair flooring defects, and clear snow and ice promptly.
- Businesses increasingly use non-slip materials, prompt cleanup protocols, and even automated monitoring systems to detect hazards.
- Older adults can reduce risk through exercise, vision checks, home safety modifications, and medication reviews.
In Canada and northern U.S. states, where ice and snow add to fall hazards, municipalities face particular challenges. Courts in both countries emphasize reasonable maintenance and timely removal of hazards as the standard for liability.
Slip and fall accidents continue to be a major source of injury and legal claims. They impose significant health, financial, and social costs, especially for older adults and workers. For property owners, prevention is the best defense; for lawyers, careful documentation of the hazard, injury, and negligence remains key. The law in both the U.S. and Canada is clear: those who control property have a duty to maintain it safely, and when that duty is breached, accountability follows.
| Geography | Metric | Figure | Year / Notes |
| Canada (age 65+) | Fall-related hospitalizations (excluding Quebec) | 81,599 | Fiscal year 2023/24. |
| Canada (age 65+) | Crude hospitalization rate | 14.1 per 1,000 older adults | Canada (excluding Quebec), FY 2023/24. |
| Canada (age 65+) | Fall-related emergency department visits (Ontario & Alberta) | 212,570 | Fiscal year 2023/24. |
| Canada (age 65+) | Crude ED visit rate (Ontario & Alberta) | 58.9 per 1,000 older adults | Fiscal year 2023/24. |
Medical Malpractice
Medical malpractice remains one of the most complex areas of personal injury law. It involves highly technical evidence, emotional stakes, and significant financial implications. The data show a field characterized by relatively few cases but exceptionally high costs and outcomes that vary sharply by jurisdiction.
- Claim Frequency and Scale
Medical malpractice cases account for a small share of total personal injury claims (≈15%), but their financial impact is disproportionate.
- Around 17,000 malpractice lawsuits are filed each year in the U.S., yet most incidents of medical error never lead to litigation.
- In 2024, the National Practitioner Data Bank (NPDB) recorded 10,217 payment events, totaling $4.33 billion, for an average payout of $423,600 per claim.
- These payments range from modest settlements to multi-million-dollar verdicts, making the average a broad indicator rather than a typical value.
Barriers to filing include patient unawareness of error, difficulty proving negligence, and limited economic damages that make some claims impractical to pursue.
- State-by-State Variations
Malpractice outcomes differ dramatically among states due to damage caps, procedural rules, and jury attitudes.
| State | 2024 Total Payouts | Claims | Average per Claim | Key Legal Context |
| New York | $372.4 M | 659 | ~$565 K | No cap on non-economic damages; traditionally plaintiff-friendly. |
| Florida | $203.9 M | 670 | ~$304 K | No current cap (former caps struck down); tort-reform focus. |
| California | $162.9 M | 513 | ~$317 K | MICRA cap raised in 2023 from $250 K to $350 K. |
| Wyoming | $9.5 M | 4 | ~$2.37 M | Highest per-claim average; small-sample effect from catastrophic cases. |
- Historically, New York, Pennsylvania, New Jersey, and Illinois produce the largest payouts.
- Tort-reform states (e.g., Texas, after 2003) show reduced filings and lower averages.
- Location strongly influences both the likelihood and the value of recovery.
- Claim Outcomes
Most malpractice claims do not result in payment to the plaintiff.
- About 65% of claims are dropped, dismissed, or withdrawn (AMA).
- Of the cases that reach trial, physicians win about 75%.
- When compensation occurs, it is usually by settlement, not verdict.
Large jury awards—like $60 M and $120 M cases in New York—are rare and often reduced on appeal.
- The median payout nationwide (≈ $679 K) better reflects typical resolution values.
- The distribution is highly skewed: a few large verdicts drive up the average.
- Insurance Costs and Market Conditions
Malpractice insurance remains a major expense for healthcare providers.
- In 2022, about 36% of premiums increased, with an average rise of 8.1% among those affected.
- Causes include higher verdicts, rising claims costs, and lower insurer investment returns.
- High-risk specialties—obstetrics, neurosurgery, emergency medicine—face the steepest premiums and, in some areas, difficulty obtaining coverage.
Persistent premium pressure fuels debates over access to care, tort reform, and insurance market stability.
- Defensive Medicine
Concern over lawsuits has led to widespread defensive medical practices—tests or procedures performed mainly to reduce liability risk.
- Estimated national cost: ~$46 billion annually.
- Common examples: ordering unnecessary imaging, hospital observation, or redundant consultations.
- Reform advocates cite this as a reason to curb litigation; patient advocates counter that better transparency and safety culture, not reduced accountability, is the solution.
- Recent Legal Developments
- California’s MICRA Reform (2023): Raised non-economic-damage caps from $250 K → $350 K (and $500 K for wrongful death), with phased increases to $750 K/$1 M over ten years.
- Florida (2023): Broader tort-reform package affecting damages and fee rules, though malpractice caps remain invalidated by prior Supreme Court rulings.
- Several states are considering “patient-compensation funds” or special health courts, while others reaffirm jury trial rights.
These policy shifts will influence claim valuation and insurer pricing over the coming decade.
- Patient and System Impact
For injured patients, malpractice litigation can be difficult but vital.
- Claims can provide lifelong care funding and accountability for systemic errors.
- Successful cases often drive institutional change—for example, double-reading radiology scans or enforcing surgical-sponge counts.
- Litigation thus serves as an imperfect but effective quality-control mechanism within healthcare.
- Summary and Outlook
Medical malpractice remains a field of low frequency but high consequence.
- Claim counts have generally declined over two decades, yet payouts and premiums are rising again.
- Outcomes vary sharply by state, reflecting divergent laws and jury trends.
- For attorneys, success depends on mastery of medicine, procedure, and evolving statutory caps.
- For providers, the data highlight the ongoing need for rigorous standards of care and risk management to prevent both harm and liability.
Medical malpractice remains a field of sharp contrasts — relatively few claims overall, but high-value and high-severity outcomes when they occur. Payouts vary widely by jurisdiction, reflecting differences in state laws, damage caps, and jury behavior. Over the past two decades, the number of claims has declined, influenced by tort reform, risk management, and the challenges of pursuing complex cases. However, the recent rise in insurance premiums and policy debates shows that the field is still evolving.
For attorneys, success in malpractice litigation depends on staying current with state-specific reforms, jury trends, and advances in medical science. For healthcare providers, the data reinforce the need to maintain strong standards of care and documentation to prevent both patient harm and costly litigation.
(International Context: In Canada, malpractice cases are less frequent and payouts are lower, largely due to the structure of damages and the strong defense provided by the Canadian Medical Protective Association (CMPA). While million-dollar settlements are rare, the underlying issues—diagnostic errors, communication failures, and system safety gaps—mirror those in the U.S. Global efforts continue to focus on improving patient safety and reducing preventable medical harm.)
Demographics and Geographic Disparities
Injury rates and compensation amounts are not the same for everyone or everywhere. Age, job type, income, and location all affect who gets hurt and how much they recover. State laws and local jury patterns also shape outcomes. This section looks at how personal injury results differ across groups and regions.
The Role of Socioeconomic Status in Personal Injury Outcomes
Socioeconomic status (SES) strongly influences both the likelihood of injury and the outcome of personal injury claims. Income, education, and access to resources affect every stage of a case. From accident risk to legal representation to compensation. Understanding these disparities helps ensure fair treatment and better advocacy for clients in both the United States and Canada.
- Injury Risk and Socioeconomic Conditions
People in lower-income communities face higher risks of injury.
- A national study found that U.S. counties with high poverty rates experienced more unintentional injuries between 1999 and 2012.
- Contributing factors include older and poorly maintained housing, high-risk jobs such as construction or driving, and limited access to safer vehicles or equipment.
- Poor access to preventive healthcare also increases risk, as untreated conditions like poor vision or diabetes can lead to accidents.
These conditions make injury risk a social and economic issue as much as an individual one.
- Access to Legal Representation
While contingency fees make representation accessible to many, significant barriers remain for lower-income clients.
- Some individuals may not realize they have a valid claim or may accept early, low settlements due to financial pressure.
- People with higher education or income are generally more proactive about seeking legal help.
- Language barriers, immigration concerns, and limited legal awareness also reduce access.
- Bias can influence case intake, as some attorneys may view certain clients or cases as less credible or too costly to pursue.
Improving outreach and education can help narrow these gaps in access to justice.
- Ability to Wait for Fair Compensation
Financial security affects a client’s ability to wait for an appropriate settlement or verdict.
- Clients with savings, steady income, or insurance can afford to wait for a fair resolution.
- Lower-income plaintiffs often face immediate expenses and may accept early offers to meet urgent needs.
- Insurers may exploit this pressure by offering smaller settlements quickly.
Litigation funding can help but often comes with high interest rates, making it a limited and sometimes risky option.
- Case Preparation and Evidence
SES influences the quality and completeness of evidence presented in a case.
- Higher-income individuals can afford immediate legal assistance, comprehensive medical documentation, and consistent treatment.
- Lower-income plaintiffs may have gaps in medical care or delayed treatment due to lack of insurance or transportation.
- Defense attorneys may use these gaps to argue that injuries were minor or unrelated.
- Bias can also affect courtroom perception: appearance, speech, and confidence can unconsciously influence juries.
These differences directly impact case strength and settlement value.
- Jury Perceptions and Compensation Awards
Jurors bring their own experiences and biases into deliberation.
- Some may view lower-income plaintiffs skeptically, assuming they are motivated by money.
- Others may sympathize more with plaintiffs whose lives are visibly affected by the injury.
- Conversely, wealthy plaintiffs may receive less sympathy because jurors perceive they can absorb the loss.
- Economic damages amplify disparities: higher earners recover more for lost income and future earnings, while lower earners receive less for the same injury.
While pain and suffering damages aim to be equal, economic disparities still create uneven outcomes.
- Settlement Patterns and Trial Decisions
Economic pressure often drives early settlement decisions.
- Lower-income plaintiffs are more likely to settle quickly due to financial need.
- Higher-income plaintiffs can afford to continue through litigation or trial.
- Legal aid and advocacy organizations provide some support, but most personal injury cases are handled by private contingency-based law firms.
The ability to withstand delays in the legal process often determines the final result.
- Geographic and Community Correlations
SES disparities align closely with geography.
- Low-income urban neighborhoods experience higher pedestrian accident rates and hazardous property conditions.
- Rural low-income areas face longer emergency response times and fewer trauma care facilities.
- Wealthier states such as Massachusetts report fewer personal injury filings per capita, while Florida’s high rate (127 per 100,000 residents) reflects demographic, legal, and economic factors.
- Underfunded infrastructure, including poor roads, missing sidewalks, and inadequate lighting, also contributes to higher injury rates in low-income communities.
Socioeconomic status affects every stage of the personal injury process, including who is injured, who can file a claim, and how compensation is determined. Lawyers should consider these challenges when representing low-income clients, such as arranging medical care through liens or helping clients obtain funding to avoid accepting unfair early settlements. Broader efforts to improve safety, healthcare access, and housing conditions would help lower injury rates and reduce the need for litigation. Recognizing these patterns is essential to achieving fair and consistent outcomes in the personal injury system.
Personal Injury Trends by State and Region
Personal injury trends in the United States show clear regional differences shaped by state laws, population density, industry mix, and local attitudes toward litigation. By 2025, these differences have become more defined, with some states showing significantly higher claim rates or larger verdicts than others. In Canada, provincial systems remain more uniform, though regional variations still appear in accident and injury patterns.
- States with the Highest Filing Rates
Recent data show wide variation in how often personal injury lawsuits are filed.
- Florida continues to stand out, with about 127 injury cases per 100,000 residents, roughly 12 times the national average (based on March 2022–March 2023 data).
- The next highest states are Ohio (30.4), New Jersey (30.3), South Carolina (30.1), and Illinois (22.9) per 100,000 people.
- California and Texas have high total case counts due to population size but only mid-range filing rates.
Florida’s high rate reflects several factors: heavy tourism and traffic, a large elderly population, historically permissive insurance laws, and pockets of fraud that have since faced stronger enforcement.
- Legal Environment and Reforms
Each state’s legal framework strongly influences personal injury activity.
- Louisiana and Kentucky have traditionally seen high claim rates, influenced by insurance laws and extensive attorney advertising.
- Texas and Georgia have experienced large verdicts in trucking and industrial cases, raising settlement values in certain counties.
- Colorado and Idaho generally see fewer claims and smaller payouts due to more conservative jury tendencies.
- Florida’s 2023 reforms shortened filing deadlines, limited certain damages, and changed negligence rules, which will likely reduce future filings.
- New York remains plaintiff-friendly, with no cap on non-economic damages and historically generous juries.
- California’s 2023 change to the medical malpractice damages cap is expected to raise average payouts.
- Illinois and New Jersey maintain strong plaintiffs’ bars and continue to record high per-capita filing rates.
These state-level reforms illustrate how legislation and jury behavior can directly alter case frequency and settlement value.
- Industry and Demographic Influences
State economies and workforce composition shape the types of personal injury claims filed.
- Energy-producing regions like Texas, Oklahoma, and North Dakota see higher rates of oilfield and industrial accidents.
- Tourism-based economies like Nevada and Florida experience more premises liability claims involving hotels, resorts, and attractions.
- Urbanized states report more pedestrian accidents and medical malpractice claims due to dense populations and more healthcare facilities.
- Rural areas face higher proportions of motor vehicle and farm-related injuries.
- Climate factors matter: northern states see many slip-and-fall cases from winter ice, while those in warmer climates do not.
- Cross-Border Differences: United States and Canada
Canada’s personal injury system produces fewer lawsuits overall.
- Provincial no-fault auto insurance rules limit lawsuits for minor accidents, allowing suits only in serious injury cases.
- The availability of universal healthcare removes much of the medical-cost component common in U.S. claims.
- The U.S., by contrast, has a patchwork of fault-based and no-fault systems, which drives differences in case volume and settlement size.
These structural distinctions explain why Canadian litigation rates are lower and more predictable across provinces.
- Fraud and Enforcement Actions
Some regions continue to combat fraudulent injury claims.
- Florida and New York have seen organized fraud rings staging car crashes or slip-and-fall incidents to collect insurance payouts.
- Since 2020, federal prosecutors have used the Racketeer Influenced and Corrupt Organizations Act (RICO) to prosecute these schemes, resulting in multiple convictions and stronger deterrence.
Though fraud cases represent a small percentage of total filings, they can influence public perception and jury attitudes toward legitimate claims.
- Emerging and Evolving Challenges
New technologies and transportation models are creating novel liability issues.
- Rideshare services like Uber and Lyft have led to disputes over which insurance policies apply when accidents occur.
- Electric scooters and micro-mobility devices have introduced new types of injury claims and prompted city-level regulations.
- Autonomous vehicle testing in states like Arizona and California has produced high-profile accidents and new rules for determining liability.
These emerging areas will likely shape state-level tort frameworks in the coming years.
- Regional Patterns
Broad trends continue to define the national picture:
- The Southeast, West Coast, and urban Northeast tend to have more active litigation environments.
- The Midwest and Mountain West generally see fewer claims and lower awards.
- Florida remains the highest per-capita filer, while North Dakota ranks among the lowest due to lower population density and a more conservative legal culture.
- In Canada, Ontario has a relatively higher claim volume compared to other provinces, mostly involving auto accidents within the no-fault framework.
- Economic Impact by State
Personal injury cases impose a major economic cost nationwide.
- Motor vehicle crashes alone account for about $481.5 billion annually in healthcare costs, lost productivity, and quality-of-life impacts.
- Large states such as California, Texas, and Florida bear the greatest share due to higher populations and medical costs.
- Differences in wage levels, healthcare expenses, and insurance rates further widen the gap between states.
Location plays a major role in personal injury outcomes. Accident rates, claim values, and case results can differ sharply from one jurisdiction to another. For lawyers, understanding these local differences is essential, as a strategy that succeeds in one state may fail in another. Clients should also know that comparisons across states are often misleading because laws and jury expectations vary. For policymakers, these disparities raise a key question: should injury law be more uniform nationwide, or continue to reflect local control and experimentation? As of 2025, personal injury law remains largely shaped by state and regional factors, even as national trends influence its direction.
In the midst of all these changes and challenges, personal injury law firms are turning to practice management solutions to streamline their operations. One such solution is RunSensible, a feature-rich legal Customer Relationship Management (CRM) and practice management platform designed to address the specific needs of law firms, including personal injury practices.
What is RunSensible and how can it help? RunSensible is an all-in-one software suite that helps law firms organize and automate many aspects of their work. Here are some of the key features and benefits relevant to personal injury attorneys:
- Customizable Intake Forms: Personal injury firms often deal with a high volume of inquiries (every call or web form could be a potential new case). RunSensible allows you to create custom intake forms that prospective clients can fill out online. These forms can capture all relevant details about an accident or injury, and the data goes straight into the CRM. This means no potential client information slips through the cracks, and staff don’t have to re-key data from paper forms.
- Automated Communications: Keeping in touch with clients (and leads) is crucial. RunSensible offers automation for emails and texts – for example, you can set up an automated welcome email when a client signs up, or reminders for appointments, or periodic case updates. Consistent communication improves client satisfaction and saves time. For instance, rather than manually emailing every client about an upcoming deposition, the system can send out a template email to all clients who have depositions scheduled that week.
- Calendar Integration and Reminders: Missing a deadline can be disastrous in law (think: statute of limitations or a court filing deadline). RunSensible provides a centralized calendar that integrates with your firm’s calendars (like Outlook or Google Calendar). You can schedule events like court dates, discovery deadlines, medical exams, etc., and assign them to case files. The software can send custom reminders to attorneys and staff – ensuring, for example, that everyone gets a reminder 1 week and 1 day before a trial date or that a follow-up call with a client is not forgotten. These reminders help reduce stress and prevent things from slipping through the cracks, especially as a firm scales up its caseload.
- Document Management and Storage: Personal injury cases generate a ton of documents – medical records, police reports, witness statements, pleadings, settlement brochures, and more. RunSensible includes secure document storage where all case-related files can be uploaded and organized. It’s like having a digital case file accessible from anywhere. Moreover, you can tag documents or use folder structures so that, say, all “Medical Records” are in one place. This not only saves physical space (going paperless) but also makes it faster to retrieve information. Need the operative report from a client’s surgery? With RunSensible, you could pull it up in seconds if it’s been stored and labeled, rather than digging through a filing cabinet or multiple emails.
- Task Management and Workflow Automation: A personal injury case goes through stages – intake, investigation, treatment, demand, maybe lawsuit, discovery, etc. RunSensible allows firms to create task lists and workflows. For instance, when a new case is opened, the system can automatically generate a checklist of tasks (“Send representation letter to insurance,” “Request police report,” “Schedule initial client meeting,” etc.) assigned to appropriate team members. As tasks are completed, they can be checked off, and the case moves along the pipeline. Automated workflows ensure consistency – every client gets the same level of attention and steps followed, even when things get busy. This reduces the chance of an important step being missed on a case.
- Virtual Receptionist Integration: Many personal injury firms rely on virtual receptionists or call services, especially after hours. RunSensible can integrate with virtual receptionist services, meaning that when a call comes in, the information collected by the receptionist can directly populate into the system. It can even trigger alerts to attorneys for urgent calls. This seamless integration means better client service – callers get a human response 24/7 – and the firm still captures their info for follow-up.
- Compliance and Security: Legal practice involves sensitive information. RunSensible is fully compliant with GDPR, HIPAA, and PIPEDA For U.S. firms, HIPAA compliance is crucial when handling medical records. Canadian firms need PIPEDA compliance for personal data. GDPR is a European standard but also has become a gold standard for data privacy. Compliance in this context means the software has robust security (encryption, access controls) and policies in place to protect client data and privacy. This gives peace of mind that using the software won’t inadvertently expose the firm to a data breach or privacy violation. With cyber threats on the rise, knowing your practice management tool is secure is very important.
- Analytics and Insights: (Not explicitly mentioned in the snippet, but often part of such platforms.) RunSensible likely provides reporting features – e.g., you can run reports on how many cases were signed this month, or average time from intake to settlement, etc. These insights can help firm management make informed decisions (like maybe you notice cases from a certain referral source settle faster, or a certain adjuster leads to more trials – data that can shape strategy).
By leveraging tools like RunSensible, personal injury lawyers can focus more on delivering the best outcomes for their clients and less on administrative headaches, Book a personalised demo now! Many lawyers start practicing to fight for justice, not to shuffle paperwork or chase down missing information. Automation and organization free them from mundane tasks and reduce stress. It also benefits clients: when a firm is well-organized, clients get timely updates, their paperwork is filed correctly, and their case progresses without unnecessary delays.
Finally, it’s worth noting that while we highlight RunSensible here, the core message is that technology can greatly enhance a law firm’s efficiency and compliance. RunSensible is one option that wraps many capabilities into one package, making it attractive to law firms that don’t want to juggle multiple software for CRM, documents, email, etc. As personal injury law continues to evolve, firms that adopt such tools will likely have an edge in managing higher caseloads, responding faster to clients, and generally running a more profitable practice with less chaos.
(Disclosure: Always ensure to choose a software that fits your firm’s size and needs. RunSensible is cited as an example here and appears to be tailored to law firms, which can be beneficial over generic project management tools. Regardless of platform, the principles of automation, secure data handling, and client management are universally applicable.)
Final Thoughts
Personal injury law continues to evolve as courts, legislatures, and technology shape new standards of liability. The number of cases remains steady, and injured people continue to rely on lawyers to recover fair compensation. About 95 percent of claims settle before trial, which makes case preparation, accurate valuation, and precise documentation essential for effective negotiation.
A strong personal injury case rests on clear legal foundations:
- Duty of care – showing that the defendant had a legal obligation to act with reasonable caution.
- Breach – proving that this duty was not met.
- Causation – linking the defendant’s actions directly to the injury.
- Damages – documenting the full extent of harm, including medical costs, lost income, and pain and suffering.
Attorneys must also be aware of procedural limits that define the claim:
- Statutes of limitation control how long a plaintiff has to file.
- Comparative negligence rules determine recovery when both parties share fault.
- Damage caps in some states restrict non-economic awards.
- Understanding these limits is critical to preserving a client’s rights.
Legal practice in this area also depends on reliable data. Injury and settlement statistics help assess case value, estimate exposure, and advise clients with accuracy. Courts increasingly expect claims to be supported by documented losses and verified evidence. Expert testimony, medical records, and consistent treatment histories remain the strongest tools for proving causation and damages.
New developments are reshaping the field. Emerging claims involving autonomous vehicles, defective products, and data-related harm will test how traditional negligence law applies to modern risks. At the same time, reforms in state tort laws and attention to mental and emotional injuries are expanding the scope of recovery in some jurisdictions.
The goal of personal injury law remains constant: to make injured people whole and hold negligent parties accountable under established legal standards. Lawyers who combine up-to-date legal knowledge with strong evidence and clear communication will continue to achieve fair outcomes and reinforce public safety.
FAQs
1. Has there been an increase in personal injury cases in 2025 compared to previous years?
The number of personal injury claims filed each year in the United States has remained steady at about 400,000 cases. Within that total, some case types have shifted. Traffic-related claims rose during the pandemic years because of riskier driving, but have declined since 2023 as crash and fatality rates improved. In contrast, mass tort cases involving defective products, medical devices, or drugs have increased as more claimants join consolidated federal and state actions.
Several states also saw short-term spikes in late 2023 when plaintiffs filed early to avoid the impact of new tort reform laws that shortened filing deadlines or limited damages. Workplace injury claims continue to fall with stronger safety programs, while medical malpractice and large product liability suits remain steady.
In Canada, personal injury claim rates have stayed more consistent because of no-fault insurance and narrower grounds for litigation. Overall, the volume of personal injury litigation remains stable but active, with trends varying by jurisdiction and case type.
2. What percentage of personal injury cases settle out of court?
About 95 percent of personal injury cases are resolved through settlement before a jury verdict. Only about 3 to 5 percent go to trial. This pattern continues in 2025, as it has for many years. Trials are costly, time consuming, and unpredictable, so both sides usually prefer the certainty of a negotiated outcome. Most settlements occur during the claims process, at mediation, or shortly before trial. The few cases that do go to trial can still influence future settlements. For example, a large verdict in one case may lead insurers to settle similar claims sooner. Even among cases that reach court, many settle during the trial or in arbitration. In practice, the 95 percent figure means that nearly all personal injury matters end without a trial judgment. Attorneys still prepare each case as if it will go to trial because that preparation strengthens their client’s position in negotiations.
3. How long does the average personal injury case take to resolve?
The timeline can vary widely depending on the complexity of the case. A straightforward car accident case with clear liability and injuries might settle in a matter of a few months once you finish medical treatment. On the other hand, a complicated case (like a medical malpractice claim or a product liability mass tort) can take several years to reach resolution, especially if it goes into litigation and trial. On average, for routine personal injury cases, a range of about 6 months to 1.5 years is typical from filing the claim to getting settlement money. Many factors influence this: the severity of injuries (one shouldn’t settle before understanding long-term medical needs), the court’s schedule if a lawsuit is filed (court backlogs can add months), and the willingness of the insurance company to offer a fair amount. In 2025, COVID-related court delays have largely cleared up, but some jurisdictions still handle a bit of backlog from the pandemic pause. If a case goes to litigation, the discovery phase alone (exchange of evidence, depositions) might take a year or more. A case that settles pre-suit can often conclude faster. In summary, simple cases = months; complex or contested cases = multiple years. Your lawyer can give a better estimate based on your specific situation. Patience is often necessary to achieve the best outcome, but rest assured your attorney will push to move things along efficiently while not rushing into a low settlement.
4. What are the biggest challenges personal injury lawyers face in 2025?
Personal injury lawyers in 2025 face several key challenges:
- Navigating legal changes: Many states have been tweaking laws related to personal injury. For example, some have changed how comparative negligence works or placed caps on certain damages. Keeping abreast of these changes and adjusting strategies (e.g., filing suit before a new law kicks in, or changing where to file a case) is a constant challenge. Lawyers also brace for potential federal changes (though tort law is mostly state, things like autonomous vehicle regulations could come federally).
- Insurance company tactics: Insurance companies are always evolving their tactics to minimize payouts. In recent years, we’ve seen aggressive initial low-ball offers (sometimes aided by computer algorithms that evaluate claims), increased surveillance of claimants, and willingness to litigate more cases to verdict to deter high demands. Combating these requires thorough preparation and sometimes taking cases to trial to prove the willingness.
- Case volume and competition: The personal injury field is saturated in many markets. Lawyers must compete through marketing, which can be costly, and there’s pressure to take on a high volume of cases to maintain revenue. Balancing quantity with quality of representation is an ongoing challenge, especially for smaller firms.
- Client expectations: With the internet, clients are more informed (sometimes misinformed by Google or TV ads) and may have high expectations for compensation or quick results. Managing those expectations realistically, while still giving the client confidence, is a delicate task. Also, the rise of review platforms means a single dissatisfied client can harm a firm’s reputation, so client service is paramount.
- Technological and ethical challenges: As mentioned, integrating new technology like AI is helpful but also poses ethical questions (ensuring confidentiality and accuracy). Cybersecurity is a challenge too – law firms are targets for data breaches, so protecting client data requires investment in IT and training staff.
- Remote work adaptation: Post-pandemic, many firms are hybrid. Managing a team that’s sometimes remote and ensuring junior lawyers are properly mentored and files don’t fall through cracks is something many firms are actively working on.
In essence, personal injury attorneys juggle legal, business, and technological challenges in 2025, all while advocating strongly for clients in a competitive environment.
5. What are some significant changes in personal injury law or practice in 2025?
Several notable changes and trends have marked the personal injury landscape around 2025:
- Tort Reform Legislation: States like Florida enacted broad tort reforms (in 2023) affecting personal injury cases – for instance, reducing the statute of limitations for negligence cases, changing from pure comparative negligence to a modified system (barring recovery if a plaintiff is more than 50% at fault), and adjusting rules around medical damage evidence. These changes alter how lawyers file and value cases. California’s adjustment of its medical malpractice damages cap (raising it after decades) in 2023 is another significant legal change, impacting med mal cases going forward.
- Rise of Mass Torts: We’ve seen a continuing rise in large consolidated injury litigations – for example, litigation related to PFAS (“forever chemicals”) water contamination, which has resulted in big settlements for water systems and ongoing suits for personal injuries. Also, new drugs and devices (like certain hernia mesh implants, or upcoming litigation on things like hair relaxer products alleged to cause cancer) have become the subject of mass tort claims. The legal procedures for managing these (MDLs in federal court, for instance) have evolved to handle thousands of cases more efficiently.
- Autonomous Vehicles & New Liability Theories: With more semi-autonomous features in cars and some fully self-driving cars being tested, 2025 has brought cases where the typical driver negligence might shift to product liability against manufacturers or even claims against software developers. We’re in early days, but these cases are shaping how liability is determined when AI is involved in driving decisions. Similarly, if AI in other contexts (say, a medical AI that misdiagnoses) causes harm, new frontiers in personal injury law are being tested.
- Virtual Proceedings & Court Tech: Many court systems have permanently integrated virtual hearings for certain matters. Depositions via Zoom are common. Electronic filing is nearly universal now. This speeds up some aspects of cases and can reduce costs (no travel for minor hearings). Some jurisdictions are experimenting with virtual jury selection or remote testimony in civil cases. Lawyers have had to adapt to these formats (which require a different touch than in-person, especially to keep jurors engaged).
- Focus on Mental Health: As mentioned, a broader recognition of mental health injuries is a change. Courts are more open to claims of emotional distress or PTSD even without direct physical impact (given proper evidence). Some states have slightly relaxed the standards for what constitutes a valid emotional distress claim (traditionally very high bars). This means lawyers are more frequently including such damages and working with mental health experts.
- Law Firm Operations: On the practice side, many personal injury firms have embraced cloud-based practice management, digital marketing, and even AI-driven analysis. The way firms operate in 2025 – more data-driven, more automated – is a change from a few years back when paper files and gut instinct marketing were more the norm.
In summary, significant changes include legal reforms at the state level, the emergence of new kinds of cases (mass torts, autonomous tech), and permanent shifts in how the courts and law firms operate (virtual proceedings and tech adoption). All these changes aim, in different ways, to improve efficiency and fairness, but they also require lawyers to continuously learn and adapt.
Disclaimer: The content provided on this blog is for informational purposes only and does not constitute legal, financial, or professional advice.